| Home | Example: FX transactions (US-$/€) |
Example: Weather and radiation |
Example: The 2016 US election and Instagram | Miscellaneous | About Us |
Example: US-$/€ FX transactions – transactions in the foreign exchange marketWaveletComp includes the data set FXtrade.transactions. It gives the worldwide number of USD/euro FX (foreign exchange) transactions recorded in time intervals of five minutes in July 2010. The data set contains four full weekly cycles, plus three days at the beginning of July 2010, where a weekly (active) cycle lasts from Sunday, 21:00, to Friday, 20:55. Each cycle has 1440 five-minute time slots. The number of transactions between Friday, 21:00, and Sunday, 20:55, is 0 or close to 0. The data set is displayed in the following figure. Our goals here are:
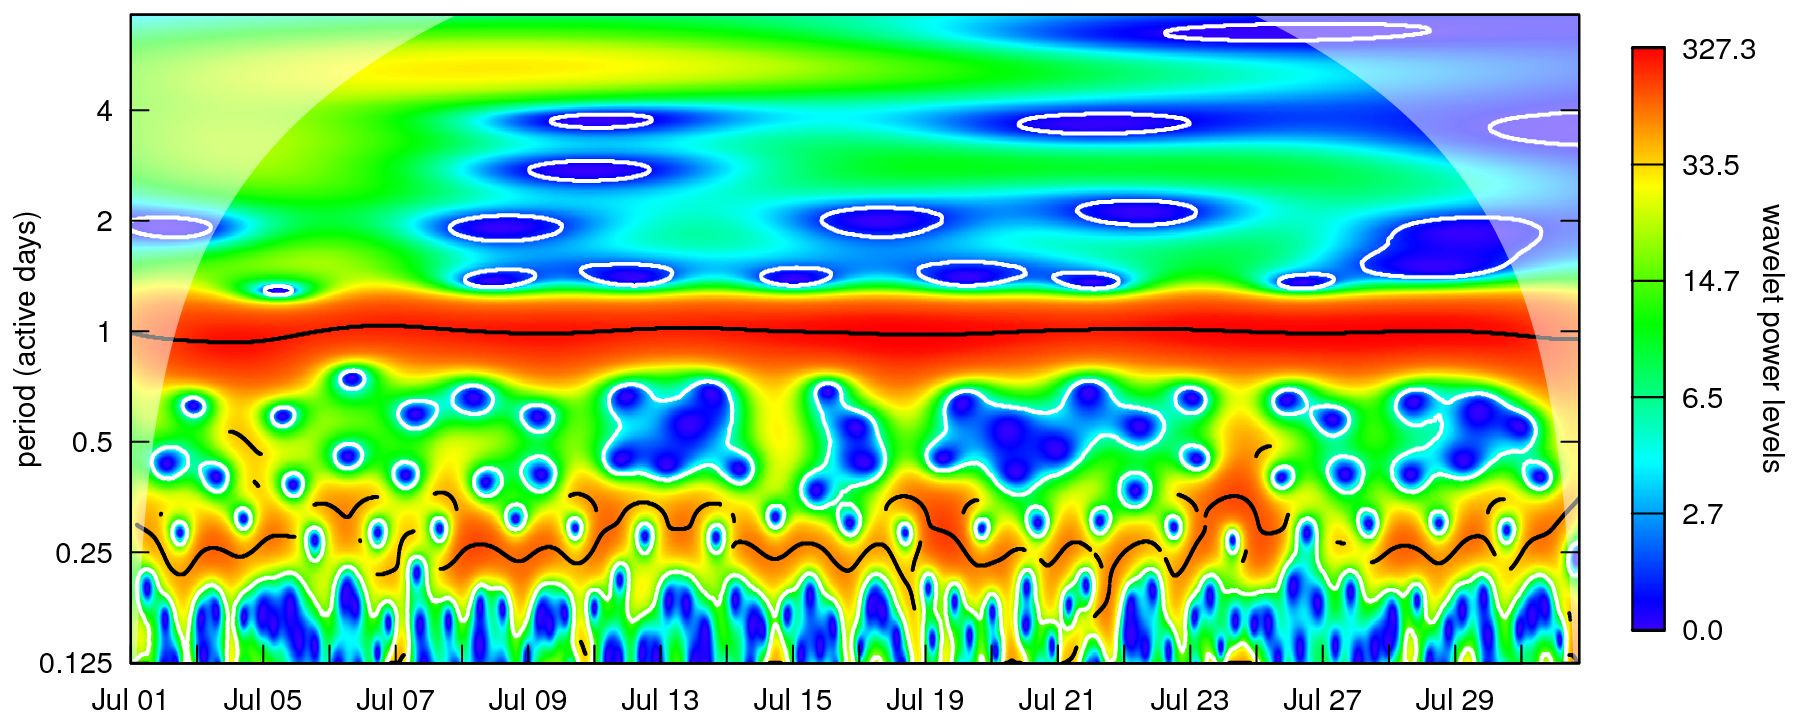
It turns out that there is no distinct seasonality below 1/8 day = 3 hours. There is a 1-day period, interrupted by weekends, and ridges indicating 3-to-4-day and 7-day periods. (The resulting wavelet power spectrum is not shown here.) An idle time interval lasts exactly 2×24 hours, and the best strategy will be to exclude idle times before conducting wavelet transformation. The resulting wavelet power spectrum is:  This plot is furnished with a different time axis. After all, weekends have been excluded! A reconstructed version of the original series, based on significant periods and with idle times filled in again, is: Transaction intensity can now be estimated by averaging, for each five-minute time slot, the four cycles shown in the previous figure. The intensity estimate (as transactions per minute) looks like this: |
Verbatim copying and distribution of the material in the entire website of the project WaveletComp are permitted worldwide, without royalty, in any medium, provided this notice, and the copyright notice, are preserved.
